Live Developer Training starts 5 October 2026. Seats are limited.Live training starts 5 OctReserve your seat →Reserve →

Power BI DAX Filter IF: Real Examples for Beginners

Power BI DAX Filter IF

A sales manager opens a monthly dashboard and sees total revenue, order count, and profit. The totals look useful, but the real question comes next: how much did the East region sell, which products crossed the target, and which orders need attention? I have built many Power BI reports that started as Excel files shared … read more…

Power BI DAX FILTER: A Practical Guide With Examples

Power BI DAX FILTER A Practical Guide With Examples

A sales manager opens a monthly dashboard and notices something confusing. Total sales look right, but the “High-Value Orders” card shows every order, not only orders above the agreed threshold. I have seen this often when teams move from Excel reports into Power BI Desktop. The report already has clean data from Excel, SharePoint, or … read more…

Power BI Date Slicer by Month: How to Use It

Power BI Date Slicer by Month

A sales manager opens a monthly dashboard and wants a quick answer: “How did March perform compared with February?” In many early Power BI reports, the date filter shows every single day. That creates a long, messy list that users avoid. I have seen this issue often when teams move from Excel reports to a … read more…

How to Create a Report in Power BI Desktop [With Real Scenarios]

How to Create a Report in Power BI Desktop

A sales manager often starts with a familiar problem: several Excel files, a SharePoint list, and no quick way to see monthly sales, top products, or low-performing regions. I have worked with teams that spent hours combining files and updating summary tables before every review meeting. That process changes quickly when you create a report … read more…

How to Add a Dropdown Slicer in Power BI

Add a Dropdown Slicer in Power BI

A sales manager opens a monthly performance report and sees regions, products, stores, and salespeople listed as large filter panels across the page. The report works, but the top half looks crowded. I have seen this often when teams move Excel reports into Power BI and want the same filtering control without sacrificing valuable dashboard … read more…

Power BI DAX MIN Date: A Practical Guide With Examples

how to find minimum date in Power BI using DAX

A sales manager opens a monthly Power BI report and asks a simple question: “When did this customer first buy from us?” The data comes from Excel files stored in SharePoint, and the report already shows revenue, orders, and product performance. Yet finding the first transaction date correctly becomes difficult once users start filtering by … read more…

Power BI Date Slicer Only Shows Dates With Data

How to show dates without data in Power BI slicer

A sales manager opens a monthly performance dashboard and wants to select a quiet day to confirm that no orders arrived. Instead, the Power BI date slicer skips that date completely. It only lists dates where the sales table has rows. I have seen this issue often in client reports built from Excel exports, SharePoint … read more…

Power BI DAX MAX Function [With Examples]

Power BI MAX measure highest sales transaction

When you build a sales dashboard in Power BI Desktop for a retail company, one of the most common requests from a sales manager is: “Show me the latest order date and the highest sales amount by month on one screen.” They want a quick way to see the top numbers without scrolling through tables … read more…

Power BI DAX Calendar Function: Create a Calendar Table Using DAX

Power BI DAX Calendar Function Create Calendar Table Using DAX Step by Step Guide

A sales manager looking at monthly performance in Power BI usually wants simple answers: “How did we do this month?”, “Are we growing vs last year?”, “What are the top 5 regions this quarter?”. The problem is, if your model doesn’t have a proper Calendar table, your time-based analysis quickly becomes messy and unreliable. In … read more…

How to Sort Slicer By Measure in Power BI?

dynamically sort slicer by measure in power bi

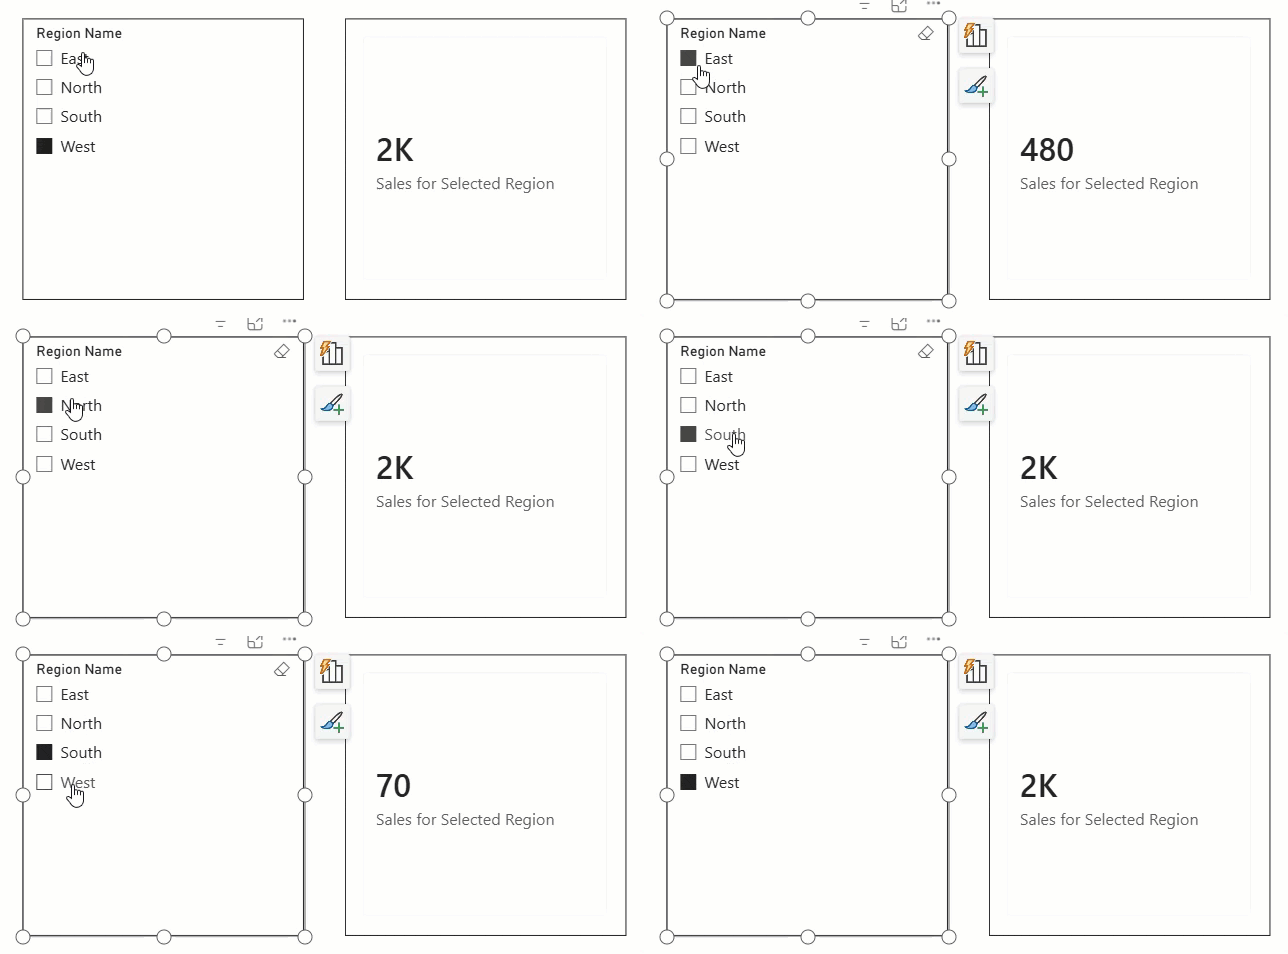
A sales manager opens a regional performance dashboard before the weekly review. The Region slicer lists East, North, South, and West in alphabetical order. That works, but it hides the story: West generated the highest sales this month, while East needs immediate attention. I have run into this situation often when converting Excel reports into … read more…

Power BI DAX TODAY() Function [With Real Examples]

What Is the Power BI DAX TODAY() Function in Power BI

A sales manager opens the monthly performance dashboard and wants to see “today’s sales” at a glance — not yesterday’s, not this month’s average, but exactly what is happening right now. The problem is that most reports are built with static dates, so they go out of date as soon as the month changes or … read more…

How to Filter Blank Value in Power BI [With Examples]

Remove Blank Values Using Visual-Level Filter in Power BI

When I build a sales dashboard in Power BI for a retail client, one of the first complaints I hear from the sales manager is, “Why do I see (Blank) everywhere?” It shows up in category slicers, bar charts, and even KPI cards, making the report look broken even when the data is fine. Often … read more…