
A few days ago, we received a requirement to create a timesheet for the selected month in the Power Apps application. This timesheet needs to display the selected month’s week names, starting from the first date to the last date, dynamically.
In this article, I will explain how to create a monthly timesheet in Power Apps step by step.
Create Power Apps Monthly Time Sheet
In the example below, you can see that the Power Apps timesheet contains a dropdown control with month names. When im select any month, the weekdays from the first date to the last date of that month appear in the gallery, and weekends are disabled.
I can provide the working hours on weekdays. There is a WK field at the end of each week, which calculates the total working hours for that week. Next, the MO field calculates the total sum of working hours across all weeks.
Finally, the total chargeable hours are displayed at the bottom. At the top, I im also showing the current logged-in user’s display name and ID as their employee number.

Follow the steps below to achieve this!
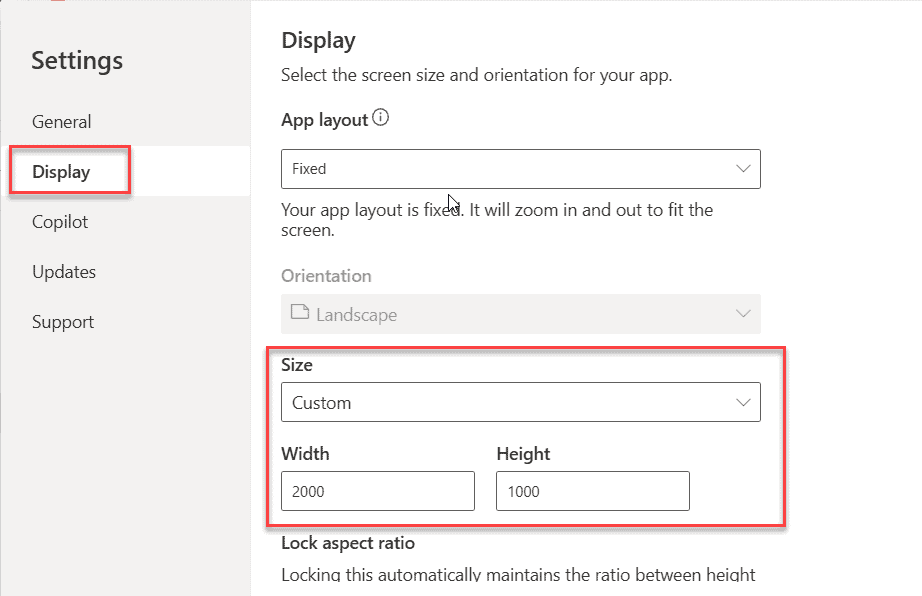
- Open the Power Apps application, click the Settings icon on the top ribbon, and then the settings page will open, as shown below. Click on Display, choose the Custom option in the Size setting, and then provide the Width and Height according to your needs.
- In the new screen, add two text input controls and a dropdown control. Then provide the formulas below in the mentioned properties.
- txt_EmpName control’s Default property:
User().FullName- txt_EmpNumber control’s Default property:
User().EntraObjectId- drp_Month control’s Items property:
[
    "January 2025",
    "February 2025",
    "March 2025",
    "April 2025",
    "May 2025",
    "June 2025",
    "July 2025",
    "August 2025",
    "September 2025",
    "October 2025",
    "November 2025",
    "December 2025"
]- Provide the formula below in the OnVisible property of the current screen.
ClearCollect(colHours, []); Here, we created an empty collection named colHours using the ClearCollect() function.
- Then, add the following formula to the OnChange property of the drp_Month control.
Clear(colHours);

Set(
    varSelectedMonth,
    Month(DateValue("01 " & drp_Month.Selected.Value))
);
Set(
    varSelectedYear,
    Year(DateValue("01 " & drp_Month.Selected.Value))
);
Set(
    varStartDate,
    Date(varSelectedYear, varSelectedMonth, 1)
);
Set(
    varDaysInMonth,
    Day(DateAdd(varStartDate, 1, TimeUnit.Months) - 1)
);
Set(varMonthName, First(Split(drp_Month.Selected.Value, " ")).Value);
Set(varYearValue, Value(Last(Split(drp_Month.Selected.Value, "")).Value));
ClearCollect(
    colMonthDays,
    ForAll(
        Sequence(varDaysInMonth),
        {
            DayName: Text(DateAdd(varStartDate, Value - 1, TimeUnit.Days), "ddd"),
            DayDate: DateAdd(varStartDate, Value - 1, TimeUnit.Days),
            WeekNumber: WeekNum(DateAdd(varStartDate, Value - 1, TimeUnit.Days), StartOfWeek.Monday)
        }
    )
);
Clear(colMonthDaysWithWK);
ForAll(
    colMonthDays As d,
    Collect(
        colMonthDaysWithWK,
        d,
        If(
            d.DayName = "Fri",
            {
                DayName: "WK",
                DayDate: Blank(),
                WeekNumber: d.WeekNumber
            }
        )
    )
);

If(
    Last(colMonthDays).DayName <> "Fri",
    Collect(
        colMonthDaysWithWK,
        {
            DayName: "WK",
            DayDate: Blank(),
            WeekNumber: Last(colMonthDays).WeekNumber
        }
    )
);

// Add final MO record
Collect(
    colMonthDaysWithWK,
    {
        DayName: "MO",
        DayDate: Blank(),
        WeekNumber: Blank()
    }
);
Here,
- Using the Clear() function, we are removing the colHours collection data.
- varSelectedMonth = This variable contains the selected month number from the dropdown. For example, if we choose “April 2025”, this variable contains the value 4.
- varSelectedYear = This variable extracts the year from the selected month in the dropdown. Exe: 2025.
- varStartDate = This variable includes the 1st date of the month chosen in the dropdown. Exe: if you choose “April 2025”, this variable contains “4/1/2025, 12:00 AM.”
- varDaysInMonth = This variable holds the number of days in the selected month. Exe: if you choose “April 2025”, this variable contains 30.
- varMonthName = Holds the selected month name. For example, if you choose “April 2025”, this variable includes the month of April.
- varYearValue = It extracts the last digit of the year from the selected value in the dropdown. For example, 5, because all months end with 2025.
- colMonthDays = This collection is iterating over the number of days in a month using the variable varDaysInMonth and storing the data for the following three fields:
- DayName = It includes the days’ names, such as Mon, Tue, Wed, etc.
- DayDate = It consists of the dates, such as 1/1/2025, 12:00 AM, 1/2/2025, 12:00 AM, etc.
- WeekNumber = It contains the week numbers that start from 1,2, etc.
- colMonthDaysWithWK = Then, we created another collection to include the WK field, which appears exactly after each Friday, used for calculating the sum of working hours in a week.
- If the month ends with any weekdays except Friday, we also add the WK field to calculate the last week’s working hours.
- At last, again we are adding one more field named MO, which will display at the end of the month. This field we are used for calculating the entire month’s working hours.
- Add a Horizontal Container control from the +Insert tab, then provide the values below to the given properties.
Direction = Horizontal
Justify(horizontal) = start
Justify(vertical) = start
Gap = 0
Horizontal Overflow = Scroll
Vertical Overflow = Hide
Wrap = Off
Size [Width] = 2000
Size [Height] = 256
- Within this horizontal container, add a regular container and rename it “Cont_Galleries”. Then, add two text input controls and their corresponding text labels for “Project Number” and “Description”.
- Then, within the same regular container, add a Blank Horizontal gallery [Gal_Months]. Then, provide the values below for the given properties.
Items = colMonthDaysWithWK

Template Size = 95

Height = 80

X = lbl_Description.X+lbl_Description.Width

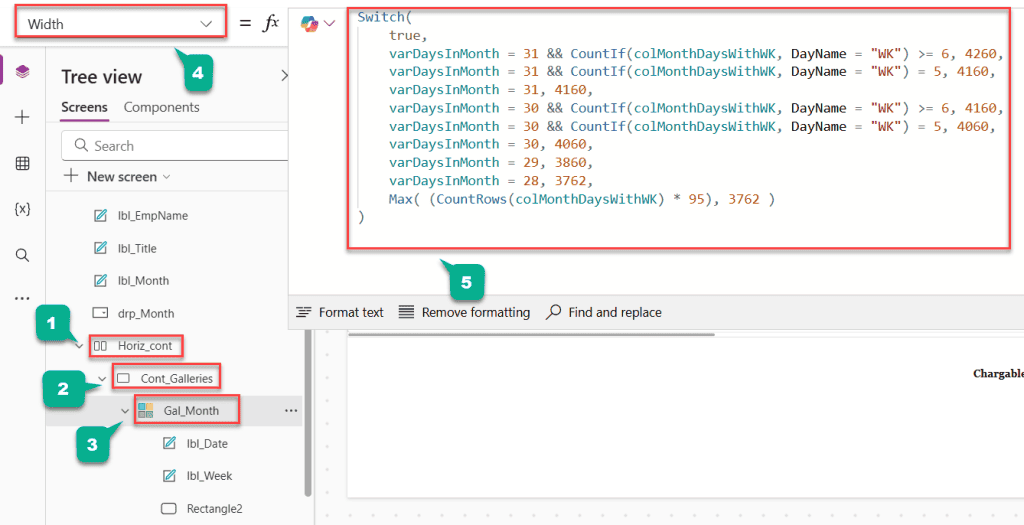
Width = Switch(
    true,
    varDaysInMonth = 31 && CountIf(colMonthDaysWithWK, DayName = "WK") >= 6, 4260,
    varDaysInMonth = 31 && CountIf(colMonthDaysWithWK, DayName = "WK") = 5, 4160,
    varDaysInMonth = 31, 4160,
    varDaysInMonth = 30 && CountIf(colMonthDaysWithWK, DayName = "WK") >= 6, 4160,
    varDaysInMonth = 30 && CountIf(colMonthDaysWithWK, DayName = "WK") = 5, 4060,
    varDaysInMonth = 30, 4060,
    varDaysInMonth = 29, 3860,
    varDaysInMonth = 28, 3762,
    Max( (CountRows(colMonthDaysWithWK) * 95), 3762 )
)
Here:
- We used a Switch() function to provide width to the gallery, because the number of days in each month will vary between 28, 30, and 31 days.
- To adjust the width of the gallery for all months, we used the following formula. Here, the varDaysInMonth variable contains the number of days present in the selected month.
- Now, within this gallery, add two text labels and one Rectangle control. Then provide the following values to the given properties.
- lbl_Week‘s Text property:
ThisItem.DayName- lbl_Date‘s Text property:
Text(ThisItem.DayDate,"d")- Rectangle’s Fill Property:
If(
    ThisItem.DayName in ["Sat", "Sun","WK"],
    RGBA(200, 200, 200, 0.5),
    RGBA(255, 255, 255, 1)
)
To display the weekend and the W